Part of the MacroHub terminal
Everybody’s wrong.
Here’s the chart.
One rule. One chart. One number — always against the S&P 500.
See today’s chartToday's chart
Chase Last Year's Winners →$10,000 became
$276,813
beat S&P · $86,775
Every idea, at a glance
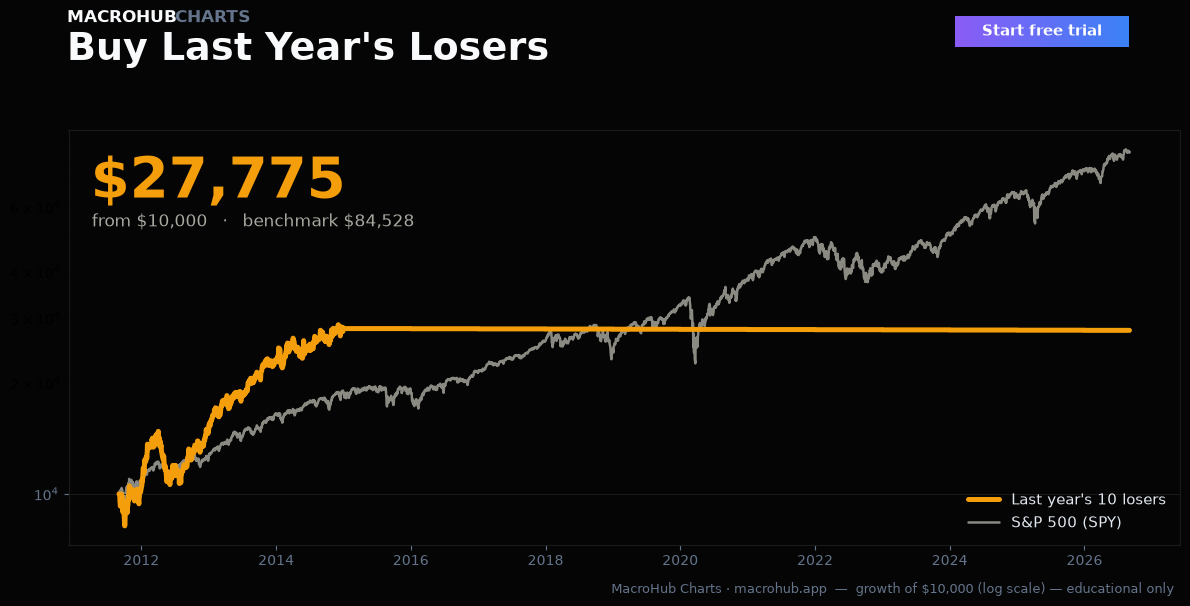
Buy Last Year's Losers
Mean reversion
$33,091
-62% vs S&P
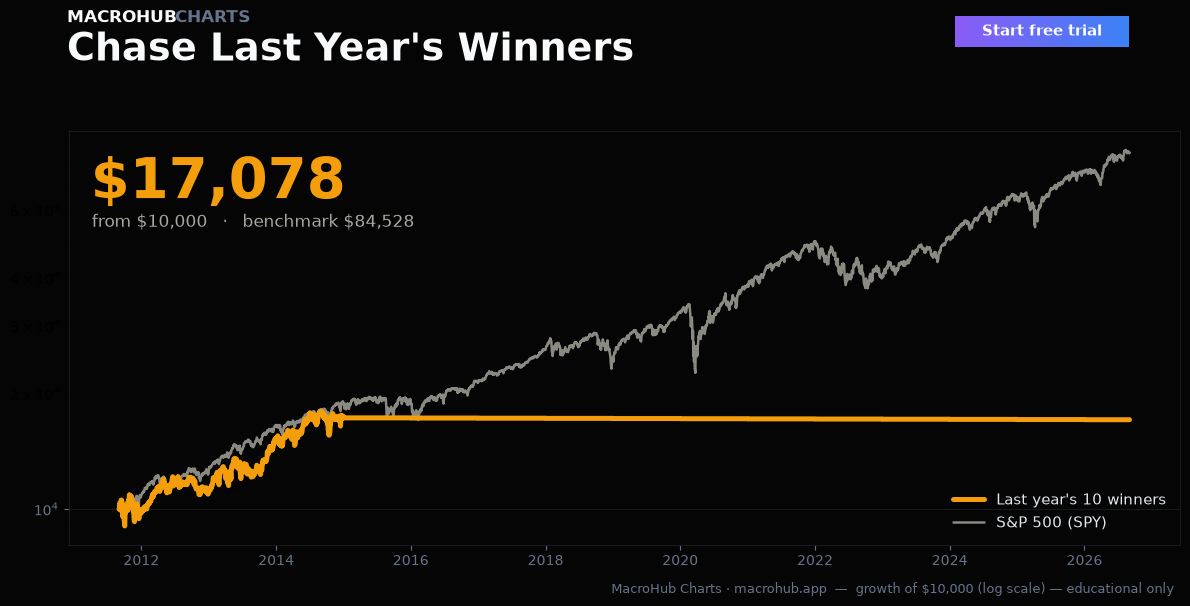
Chase Last Year's Winners
Momentum
$276,813
+219% vs S&P
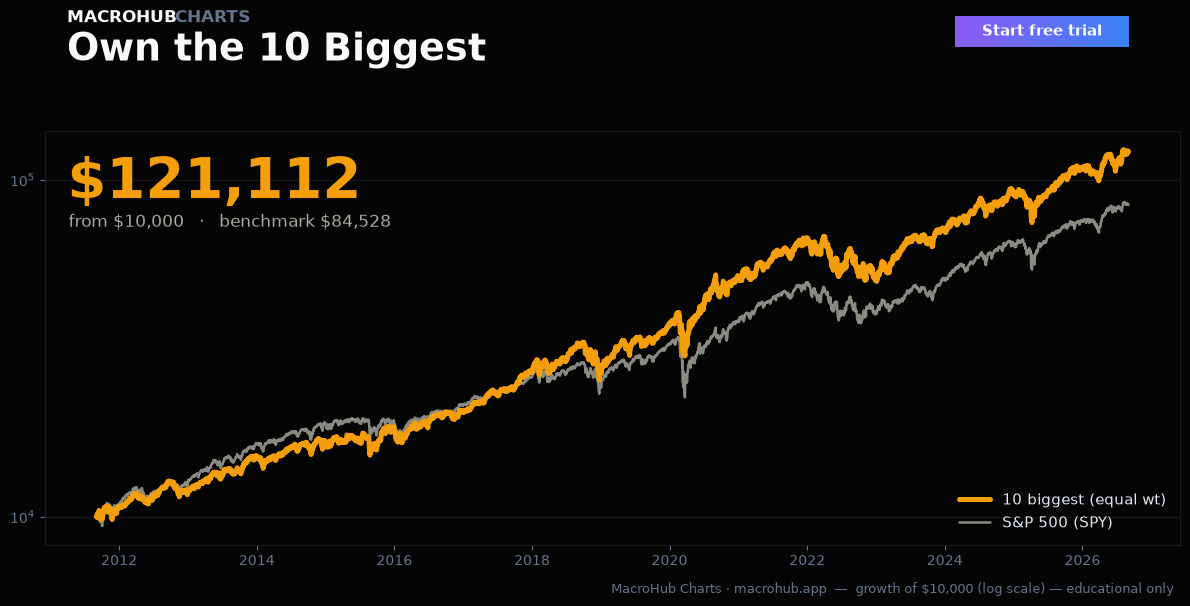
Own the 10 Biggest
Weighting
$122,833
+42% vs S&P
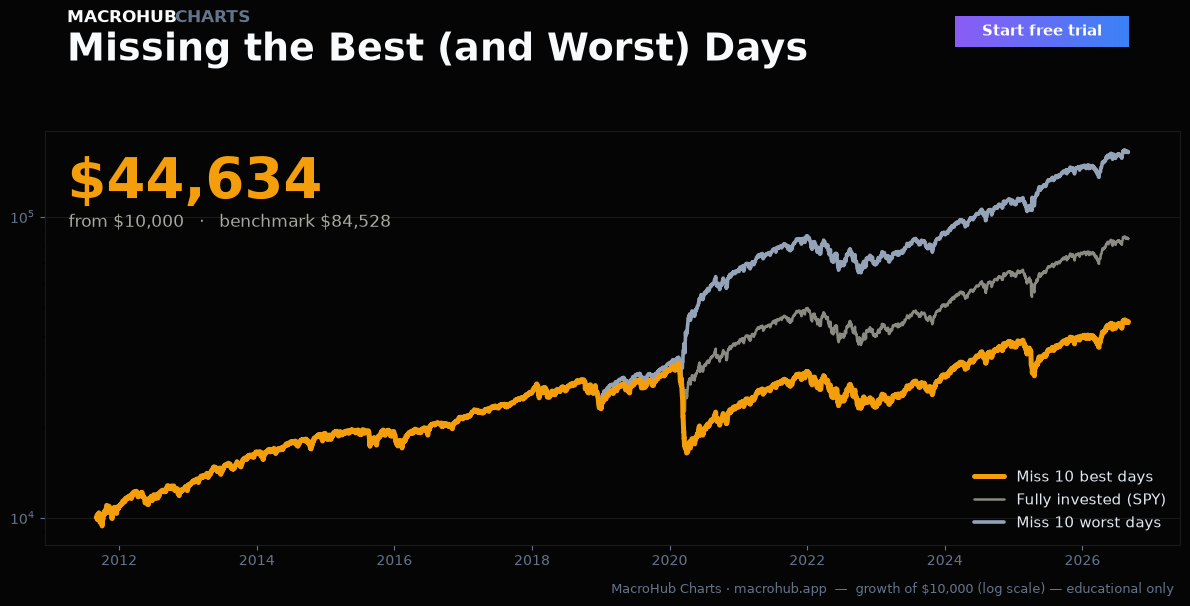
Missing the Best (and Worst) Days
Timing
$45,820
-47% vs S&P
Buy the Dip
Timing
$24,824
-71% vs S&P
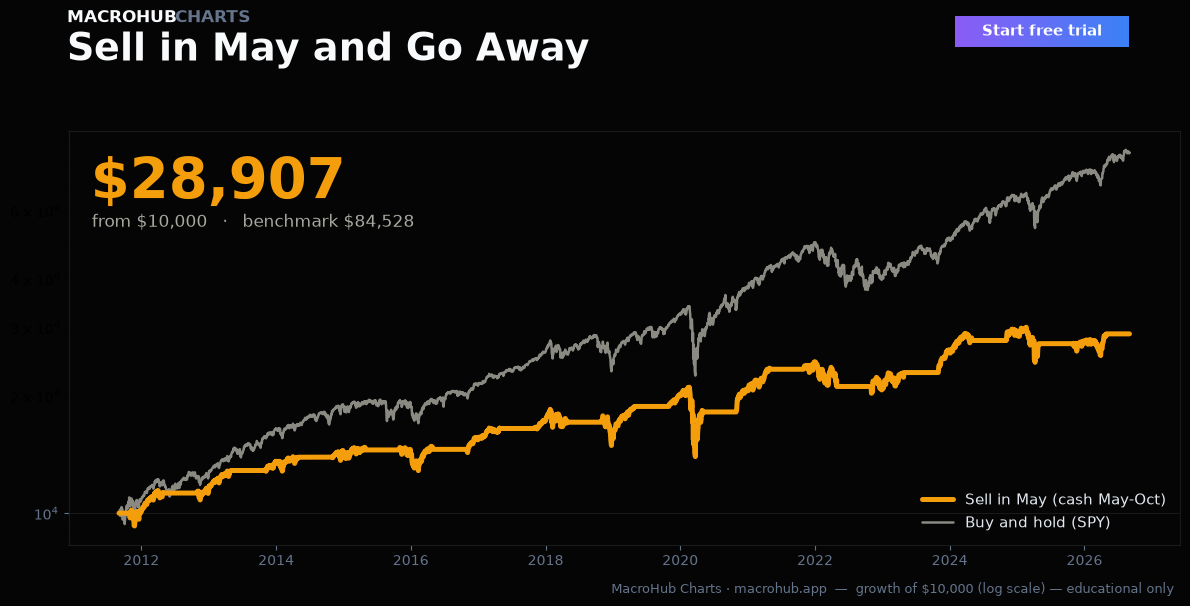
Sell in May and Go Away
Timing
$28,907
-67% vs S&P
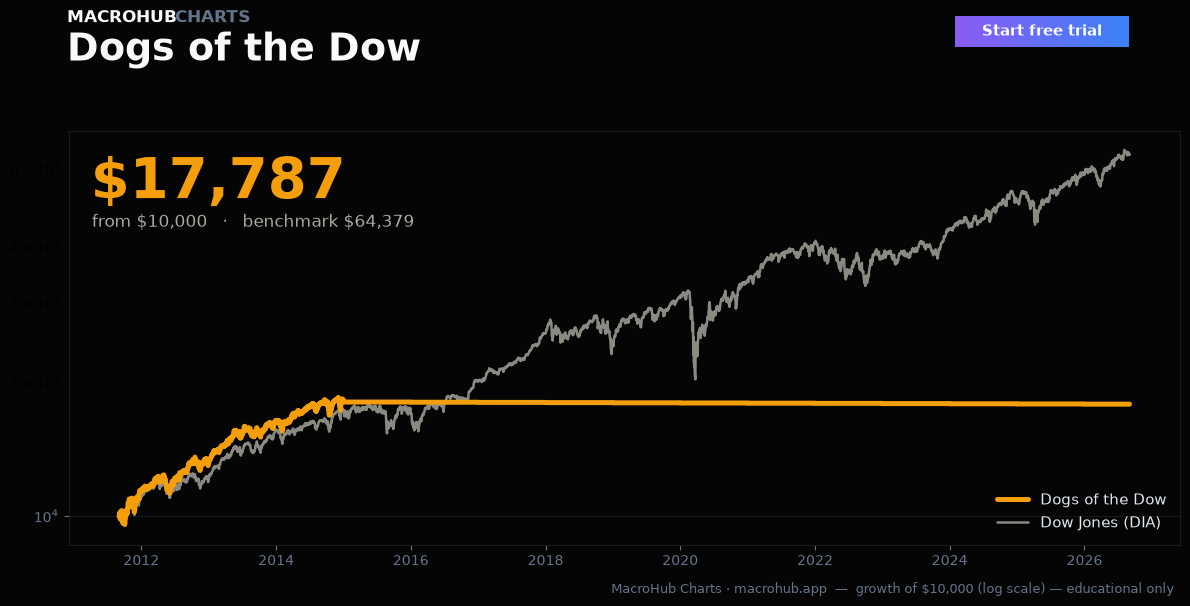
Dogs of the Dow
Value
$74,331
+16% vs S&P
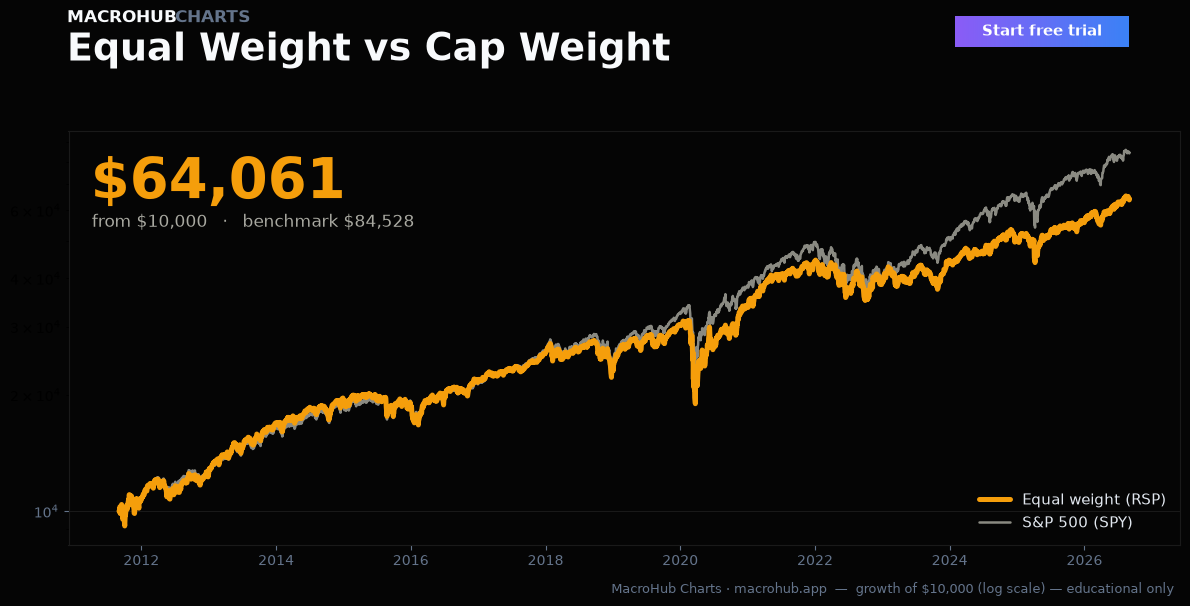
Equal Weight vs Cap Weight
Weighting
$63,834
-26% vs S&P
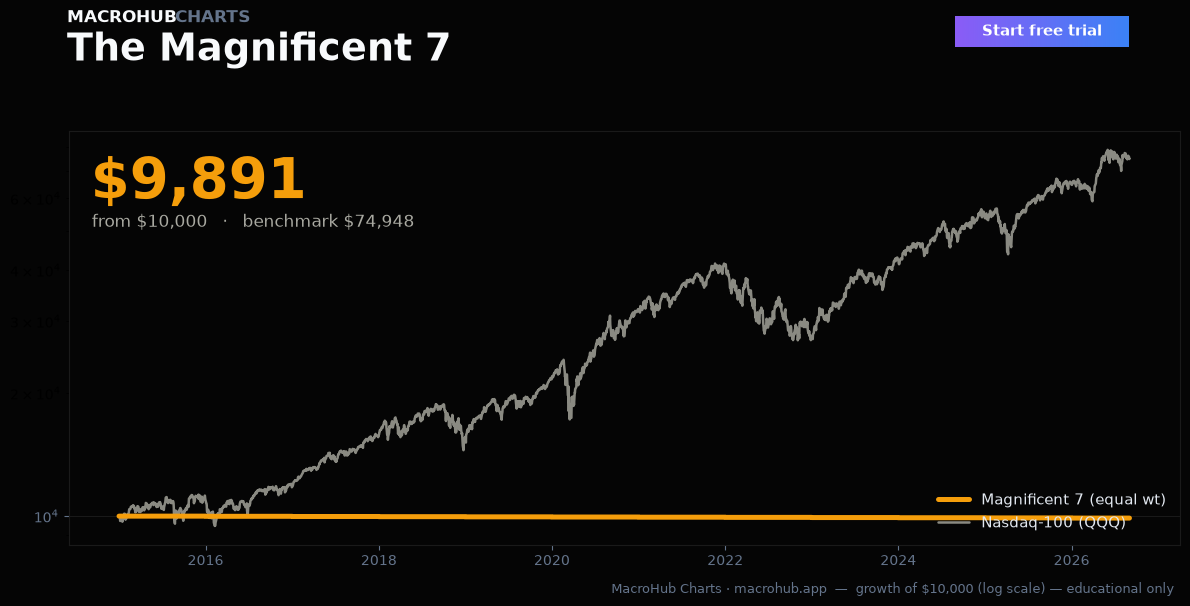
The Magnificent 7
Weighting
$435,804
+454% vs S&P
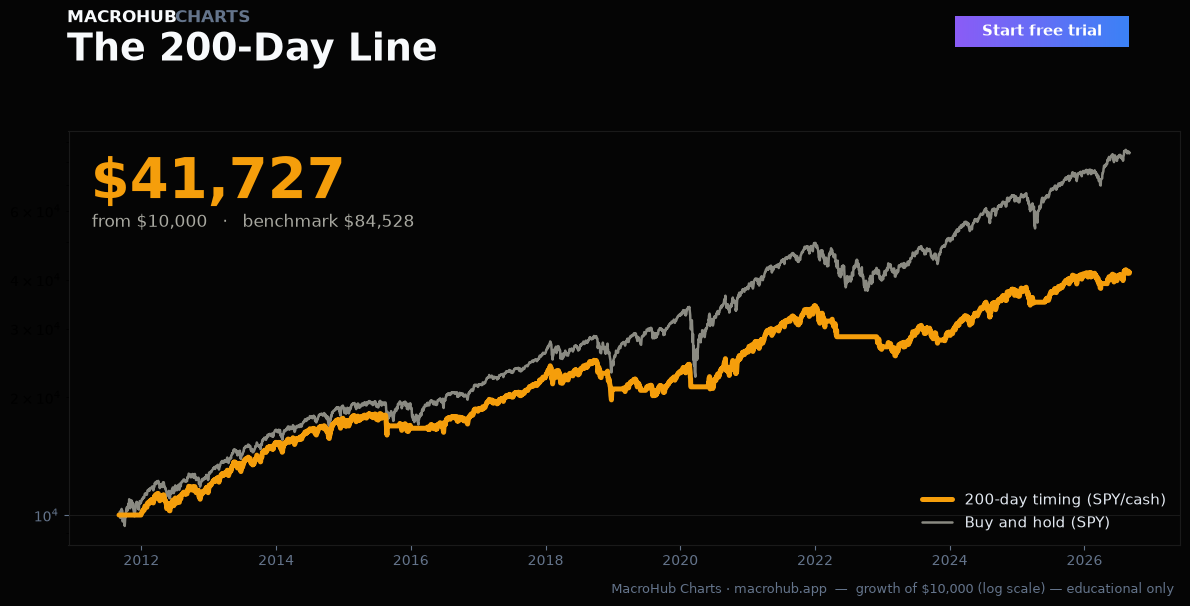
The 200-Day Line
Timing
$42,067
-52% vs S&P